


Industry Trends
Largest Transactions Closed
- Target
- Buyer
- Value($mm)

Advised Western Milling in their sale to the Western Milling ESOP Trust

Last updated:
Company valuations recovered in Q1 2026, up on revenue and earnings. Volumes declined but continues to reflect buyer preference for differentiated high-quality assets. Strategic buyers remained the dominant force, and sponsors were selective.¹ The largest Q1 2026 transactions reflect a clear shift toward megadeal-driven value creation. The macro environment turned more constructive in Q1 2026. The ISM Manufacturing PMI marking the third consecutive month of expansion in March 2026, signaling a broad-based recovery in industrial activity.² Input costs remained elevated — particularly steel, aluminum, and petroleum-based materials — reinforcing buyer focus on pricing power and supply chain resilience.³ ⁴

According to Michael Rosendahl, Managing Director at PCE “Q1 2026 demonstrated that high-quality industrial assets continue to command strong valuations despite a more selective deal environment. Buyers are moving with conviction on scaled distribution platforms, thermal and power infrastructure, and precision industrial equipment — all sectors with compelling long-term demand tailwinds.”
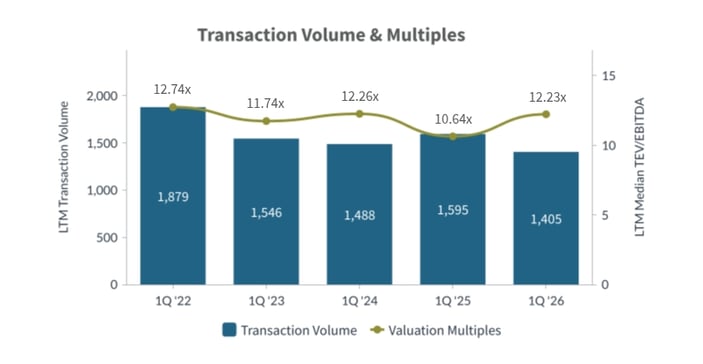
Deals: 375 in Q1 2026; 1,405 LTM (vs. 1,595 LTM a year ago). Valuations: LTM medians 12.23x EBITDA / 1.81x revenue. The quarter saw continued volume compression but a meaningful rebound in valuation multiples, suggesting ongoing “flight to quality” as buyers concentrated capital on scaled, differentiated platforms with defensible margin profiles and clear synergy pathways.
The macro environment shifted positively in Q1 2026. The ISM Manufacturing PMI rose to 52.7% in March 2026 — the third consecutive month of expansion following a ten-month contraction — with production accelerating (55.1%) and new orders growing (53.5%). Four of the six largest manufacturing industries expanded in March, including Transportation Equipment, Machinery, Computer & Electronic Products, and Chemical Products.²
Input cost pressures intensified in Q1 2026, the ISM Prices Index surging to 78.3% in March — the highest since June 2022 — driven by steel, aluminum, the war in Iran materially impacting oil prices, and tariff impacts. Management teams continued to prioritize supply-chain reconfiguration, dual sourcing, and nearshoring as a core component of acquisition rationales and diligence.² ³ ⁴
Diversified industrials M&A was anchored by megadeal activity, with 12 transactions exceeding $1 billion in Q1 2026 alone. Strategic acquirers continued to lead, pursuing scale through thermal management, power infrastructure, precision industrial equipment, and specialty vehicle platforms. Financial sponsors remained active, with improving financing conditions — interest rates settling in the 3.0–3.25% range — and approximately $2 trillion in private equity dry powder accelerating deployment discipline.¹ ⁵
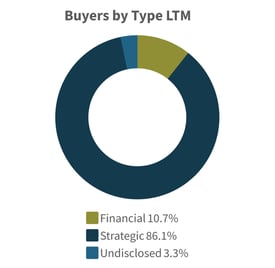
Strategic Acquirers: 1,209 of 1,405 LTM (86.05%), focused on scale and synergy capture across thermal management, power infrastructure, rail equipment, engineered machinery, and specialty vehicles.¹
Financial Buyers: 150 of 1,405 (10.68%), targeting platform-build and bolt-on opportunities with stable cash flows, supported by improved financing conditions.¹
Undisclosed Buyers: 46 of 1,405 (3.27%), primarily private operators and smaller strategic outcomes.¹
Total Transactions: 1,405 LTM
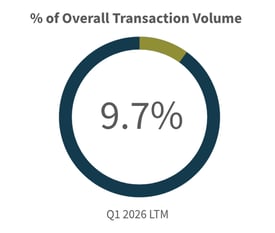
Diversified Industrials represented 10.66% of overall Q1 2026 U.S. M&A volume (375 of 3,516 deals in Q1) and 9.73% of LTM activity (1,405 of 14,447 LTM). The sector’s share of total deal value was amplified by a concentration of megadeals, with 12 transactions exceeding $1 billion and total Q1 disclosed deal value of approximately $44.0 billion. Buyers continued to prioritize resilient cash flows, scalable distribution platforms, and synergy-forward industrial assets.¹
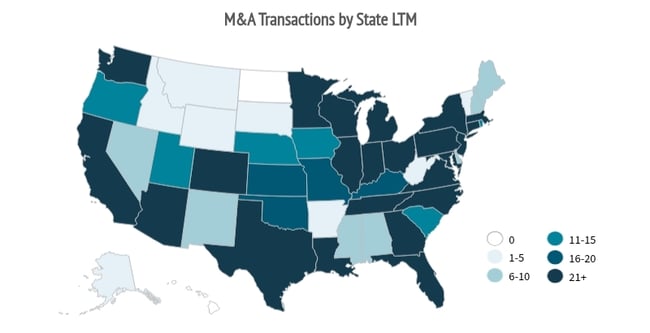
Top U.S. states by seller count (LTM): Texas (145), California (130), Florida (109), Illinois (66), Pennsylvania (59), North Carolina (52), Ohio (52), Michigan (47). Texas, California, and Florida continued to dominate deal activity, reflecting population growth, construction demand, and industrial manufacturing density. The broader Sunbelt and mid-Atlantic regions showed strength, while Midwest and industrial heartland states remained active in manufacturing, machinery, and MRO distribution.¹
| Target | Buyer | Value |
| Thermal Business of Boyd Corporation | Eaton Corporation plc | $9,500.00 |
| SPX FLOW, Inc. | ITT Industries Holdings, Inc. | $4,779.20 |
| Rail Assets of Wells Fargo & Company | GATX Corporation; Brookfield Infrastructure Partners L.P. | $4,200.00 |
| Hillenbrand, Inc. | Lone Star Americas Acquisitions, Inc. | $3,980.90 |
| REV Group, Inc. | Terex Corporation | $3,274.10 |
| US-based Metal Container Plants of Anheuser-Busch InBev | Anheuser-Busch InBev SA/NV | $2,900.00 |
| Kito Crosby Limited | Columbus McKinnon Corporation | $2,700.00 |
| ENTRUST Solutions Group, LLC | Leidos, Inc. | $2,400.00 |
| TC Transcontinental Packaging Inc. | ProAmpac Intermediate, Inc. | $1,516.70 |
| OmniMax International, Inc. | Gibraltar Industries, Inc. | $1,335.00 |
| Target | Buyer | Value |
| United Utility Services, LLC | Sandbrook Capital Management LP; Blackstone Credit & Insurance | $1,000.00 |
| Kyocera Industrial Tools, Inc. | Truelink Capital Management, LLC | $480.80 |
| Thomas Precision Machining, Inc. | Radial Equity Partners LP | n/a |
| GasClip Technologies LLC | Chimney Rock Equity Partners, LLC | n/a |
| Five Star Sales & Service Inc | Galaxy Service Partners LLC | n/a |
| Sylvester's Maintenance & Mechanical LLC | Galaxy Service Partners LLC | n/a |
| MacDonald & Owen Veneer And Lumber Co., Inc. | Spell Capital Partners, LLC | n/a |
| Specialty Fenestration Group | Victor Capital Partners LLC | n/a |
| AM/PM Door Inc. | Galaxy Service Partners LLC | n/a |
| Target | Buyer | Value |
| National Diversified Sales, Inc. | Advanced Drainage Systems, Inc. | $1,000.00 |
| J-W Power Company | USA Compression Partners, LP | $888.93 |
| Hanley Energy LLC | Jabil Inc. | $783.00 |
| Leonard Valve Company, LLC | A. O. Smith Corporation | $470.00 |
| Koch Filter Corporation | Atmus Filtration Technologies Inc. | $450.00 |
| The Bowers Group, Inc. | Legence Corp. | $421.32 |
| TechPro Power Group Inc. | Integrated Power Services, LLC | $350.00 |
| Crawford United Corporation | SPX Enterprises, LLC | $314.97 |
| Mckee Utility Contractors, Inc. | MasTec, Inc. | $276.00 |
| A.L. Grading Contractors, LLC | Cardinal Infrastructure Group Inc. | $245.50 |
Source S&P Capital IQ as of 4/6/2026 and PCE Proprietary Data
Opportunities: Continued strategic interest in thermal management, power infrastructure, electrification-adjacent equipment, precision fluid control, and specialty vehicles with recurring aftermarket revenue. Infrastructure-linked subsectors — including electrical equipment, utility services, and filtration — are well-positioned given sustained capital investment in grid modernization, AI data center build-out, and domestic manufacturing reshoring. Strategic acquirers are expected to remain the dominant driver of volume, supported by synergy economics and portfolio optimization objectives.3 5
Risks: Elevated input costs (ISM Prices Index at 78.3% in March 2026), ongoing tariff policy uncertainty, geopolitical disruptions, and potential trade policy volatility could pressure margins and slow deal pacing, especially for discretionary capex-linked subsectors. Manufacturing employment remains contractionary (ISM Employment at 48.7%).2 3
Predicted Activity: A megadeal-driven, strategy-led market with continued bolt-on consolidation. Sponsors are expected to accelerate deployment as financing conditions normalize, with a focus on sub-$1 billion platforms with defensible demand and AI/automation-enabled value creation pathways.4

Michael Rosendahl |

Ken Sommers |

Michael Poole |
Advised Western Milling in their sale to the Western Milling ESOP Trust
