


Industry Trends
Largest Transactions Closed
- Target
- Buyer
- Value($mm)

Advised Western Milling in their sale to the Western Milling ESOP Trust


Last updated:
Diversified Industrials M&A remained active in Q2 2026, with resilient valuations reflecting continued demand for high-quality assets despite a more selective transaction environment.
The quarter’s largest transactions highlighted buyer focus on scaled industrial platforms in packaging, electrical infrastructure, building products, and specialty industrials, particularly where businesses offered durable demand drivers and clear synergy potential.

Buyer priorities continued to favor assets with mission-critical products, recurring aftermarket or replacement-driven revenue, pricing power, and supply chain durability as tariff uncertainty and sourcing shifts remained central diligence considerations.² ³
“The Diversified Industrials sector continues to benefit from buyer demand for essential, performance-critical businesses,” said Michael Rosendahl, Managing Director at PCE. “Industrial distribution, engineered components, and specialty manufacturing remain attractive categories given their relevance across resilient end markets and long-term infrastructure priorities.”
Deals: 355 in Q2 2026; 1,483 LTM (vs. 1,533 LTM a year ago). Valuations: LTM medians 13.40x EBITDA / 2.18x revenue. The quarter reflected a continued flight to quality, with valuation multiples expanding even as volume compressed modestly year-over-year, signaling that buyers remained highly selective but committed to well-positioned industrial platforms.
The macro backdrop in Q2 2026 remained stable for industrial M&A. Manufacturing activity continued to show resilience, supported by domestic demand, reshoring-driven capital investment, and sustained infrastructure spending. Buyers across strategic and financial categories maintained active pipelines, prioritizing targets with defensible revenue models, recurring service components, and exposure to secular growth end markets including electrification, automation, and energy transition infrastructure.
Input cost dynamics shifted modestly in Q2 2026, with tariff policy volatility and supply chain reconfiguration continuing to influence deal rationales. Management teams remained focused on dual sourcing, nearshoring, and domestic manufacturing footprint as key components of both operational strategy and M&A diligence. The quarter’s largest transactions spanned packaging, electrical infrastructure, building products, and specialty industrials, reflecting broad-based strategic appetite across the sector.¹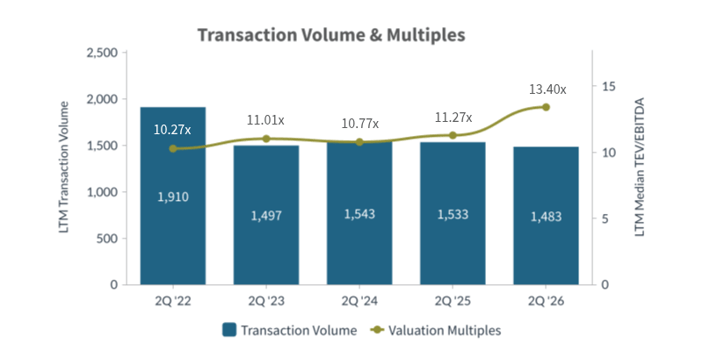
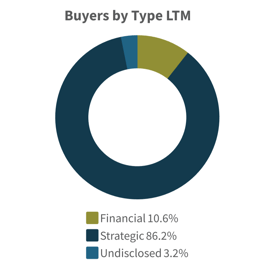
Strategic Acquirers: 1,278 of 1,483 LTM (86.2%), focused on scale and synergy capture across packaging, electrical infrastructure, building products, distribution, and specialty industrials.¹
Financial Buyers: 157 of 1,483 (10.6%), targeted platform-build and bolt-on opportunities with stable cash flows, supported by improving financing conditions.¹
Undisclosed Buyers: 48 of 1,483 (3.2%)
Total Transactions: 1,483 LTM
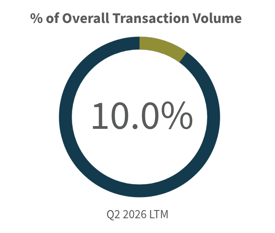
Diversified Industrials represented 11.0% of overall Q2 2026 U.S. M&A volume (355 of 3,221 deals in Q2) and 10.0% of LTM activity (1,483 of 14,849 LTM). The sector’s share of total deal value was amplified by a concentration of large-cap transactions, led by Clayton, Dubilier & Rice’s $10.6 billion take-private of Sealed Air and the $27.8 billion Sumisho Air Lease deal. Buyers continued to prioritize resilient cash flows, scalable industrial platforms, and assets with exposure to secular demand tailwinds including electrification, packaging, and infrastructure.¹
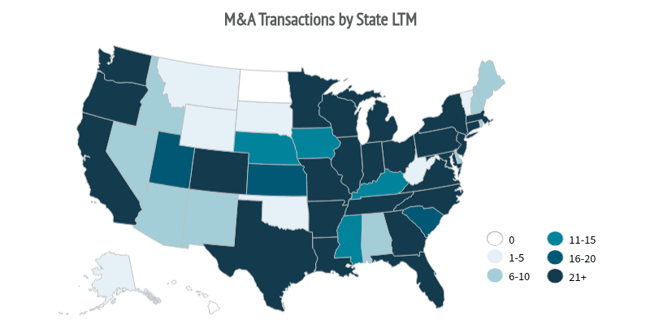
Top U.S. states by seller count (LTM): Texas (155), California (134), Florida (126), Illinois (67), Ohio (67), Pennsylvania (63), North Carolina (57), Georgia (47). Texas, California, and Florida maintained their dominance, reflecting strong population growth, construction demand, and industrial manufacturing density. The broader Sunbelt continued to drive outsized activity, while Ohio, Illinois, and Pennsylvania remained active across manufacturing, engineered components, and MRO distribution subsectors.¹
| Target | Buyer | Value |
| Sumisho Air Lease Corporation | Sumitomo Corporation; SMBC Aviation Capital Limited; Apollo Capital Management, L.P.; Brookfield Asset Management Ltd. | $27,770 |
| Sealed Air Corporation | Clayton, Dubilier & Rice, LLC | $10,595 |
| NSI Industries, LLC | Hubbell Incorporated | $3,000 |
| Kodiak Building Partners Inc. | QXO, Inc. | $2,305 |
| CPM Holdings, Inc. | Rosebank Industries plc | $2,300 |
| Thermon Group Holdings, Inc. | CECO Environmental Corp. | $2,291 |
| American Woodmark Corporation | MasterBrand, Inc. | $1,383 |
| Great Lakes Dredge & Dock Company, LLC | Saltchuk Resources, Inc. | $1,372 |
| Electrical Power Products, Inc. | Flex Ltd. | $1,100 |
| Republic Wire, Inc. | Nexans S.A. | $798 |
| Target | Buyer | Value |
| Arcosa Marine Products, Inc. | Wynnchurch Capital, L.P | $450 |
| Jinko Solar (U.S.) Industries, Inc | Fortune Harmony Investments Limited | $192 |
| I-4 Mobility Partners Opco LLC | John Laing Group Limited | $75 |
| Blast All Inc | OEP Capital Advisors L.P. | n/a |
| Cumming Management Group, Inc. | Leonard Green & Partners, L.P. | n/a |
| Target | Buyer | Value |
| North Pacific Paper Corporation | International Paper Company | $1,000.00 |
| DRC Heat Transfer | Smiths Group plc | $888.93 |
| L.B. White Company, LLC | Modine Manufacturing Company | $783.00 |
| Freeberg Industrial Fabrication Corporation | Hill & Smith PLC | $470.00 |
| I-4 Mobility Partners Opco LLC | John Laing Group Limited | $450.00 |
| Motiv Space Systems, Inc. | Rocket Lab Corporation | $421.32 |
Source S&P Capital IQ as of 7/5/2026 and PCE Proprietary Data
Opportunities: Continued strategic interest in packaging, electrical infrastructure, building products, and specialty industrial platforms with recurring aftermarket revenue. Infrastructure-linked subsectors such as electrical equipment, utility services, and power distribution remain well-positioned given sustained capital investment in grid modernization, AI data center build-out, and domestic manufacturing reshoring. Strategic acquirers are expected to remain the dominant driver of volume, supported by synergy economics and portfolio optimization goals.2 3
Risks: Ongoing tariff policy uncertainty, wage inflation compressing margins for labor-intensive businesses, higher financing costs impacting leveraged buyers, and potential input cost volatility could pressure deal pacing, particularly in discretionary capex-linked and cyclically exposed subsectors. Financial sponsor activity remains sensitive to credit market conditions and exit visibility.2 3
Predicted Activity: A strategy-led, quality-driven market with continued large-cap activity and bolt-on consolidation across packaging, electrical, and industrial services subsectors. Sponsors are expected to accelerate deployment as financing conditions normalize, focused on sub-$1 billion platforms with defensible demand, mission-critical positioning, and automation-enabled value creation pathways.1

Michael Rosendahl |

Ken Sommers |

Michael Poole |
Advised Western Milling in their sale to the Western Milling ESOP Trust
